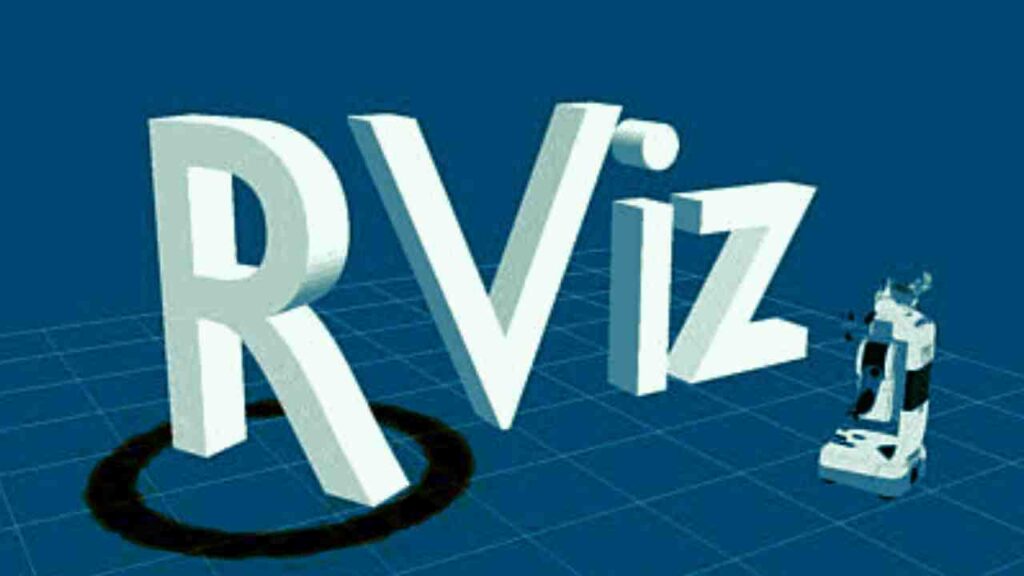
What if you could actually see what your robot sees? Would that help you build better, smarter robots? That’s exactly what RViz offers. You will be able to visualise sensor data like LiDAR scans, camera feeds, or depth maps in real-time with the help of RViz.
With RViz, developers and researchers can explore how robots interpret their environment. By turning invisible data into interactive visuals, RViz bridges the gap between code and reality. It helps you design, debug, and deploy robots faster.
Table of Contents
What is RViz in ROS?
RViz is a 3D visualization tool that is part of the Robot Operating System (ROS) ecosystem. It allows developers and researchers to visualize data from their robots, such as sensor information, robot states, and environmental data, in real-time. This helps in debugging and understanding how a robot is interacting with its surroundings.

Features of RViz
- Rviz can show data from various sensors like LiDAR, cameras, and IMUs.
- It helps to visualize robot models, including joint states and movements.
- You can use custom markers to highlight specific data points or areas in the environment.
- You can add more functionality through plugins for additional visualizations or features.
How to use RViz
RViz is like a window to the robot’s world. There are several steps involved in using RViz. In this guide, we’ll take you through the steps to go from a blank screen to a fully interactive 3D display of your robot’s world
Installation
Before getting started, ensure you have ROS already installed on your system. Fortunately, RViz comes bundled with ROS, so you won’t need to install it separately.
Now, open a terminal and type roscore to start the ROS master. Then, in a new terminal, type rosrun rviz rviz to launch RViz.
Explore the RViz Interface
Navigating RViz might seem overwhelming at first, but once you break it down, it’s like customizing a dashboard for your robot. Here’s a quick tour of the essential panels and what they offer:
Displays Panel
Think of the Displays panel as your toolkit for visualization. Located on the left side of the interface. Shows different types of data being visualized. You can add new displays here (e.g., images, point clouds).
3D Viewport
The main area where your robot and its environment are visualized. You can navigate using the mouse (middle button to pan, right button to rotate, and scroll wheel to zoom).
Fixed Frame
Defines the coordinate frame in which data is displayed. Set this to your robot’s base frame or another relevant frame.
Global Options
Set options like the background color or frame rate here.
Add and Configure Displays
Add Display: Click the “Add” button in the Displays panel. You can choose from various display types like “LaserScan”, “PointCloud2”, “RobotModel”, etc.
Configure Display: After adding a display, you can configure its properties such as topic, color, and size by expanding its entry in the Displays panel.
Visualize Sensor Data
LaserScan: To view laser scanner data, add a LaserScan display and set the topic to your laser scan data topic.
PointCloud2: For point cloud data, add a PointCloud2 display and select the appropriate topic.
Use Markers
Add Marker Display: Allows you to visualize custom markers like points, lines, and shapes.
Publish Markers: Use ROS nodes to publish markers to a topic RViz is subscribed to. This is useful for visualizing paths, goals, or other important data.
Debug and Analyze
Use RViz to check for discrepancies between your robot’s expected and actual behavior.Visualize transformations and data from sensors to ensure your robot is functioning correctly.
Using RViz with Simulators
Gazebo Integration
If you’re using Gazebo for simulation, make sure your RViz is subscribed to the appropriate topics from the simulation.
Synchronizing Data
Ensure that the timestamps and frame IDs in RViz match those used in your simulation to avoid discrepancies.
Troubleshooting
No Data Displayed
Verify that the ROS nodes are correctly publishing data and that RViz is subscribed to the correct topics.
Misalignment
Check the frame IDs and timestamps to ensure they align with your robot’s coordinate system.
By following these steps, you should be able to effectively use RViz to visualize and interact with your robot’s data.
How to install RViz
To install RViz, you’ll need to have ROS (Robot Operating System) set up on your system. Here’s a step-by-step guide to installing RViz:
Install ROS
Ubuntu
ROS is most commonly used with Ubuntu. Follow the official installation instructions for your specific ROS version (e.g., ROS Noetic, ROS 2 Humble). You can find these instructions on the ROS Wiki.
Windows/Mac
Follow the instructions provided on the ROS Wiki for installing ROS on Windows or macOS.
Install RViz
Open a terminal and use the package manager to install RViz. The command depends on your ROS version:
For ROS Noetic (ROS 1):
sudo apt-get update
sudo apt-get install ros-noetic-rviz
For ROS 2 (e.g., Humble):
sudo apt-get update
sudo apt-get install ros-humble-rviz2
Set Up Your ROS Environment
Source the ROS setup file to configure your environment. Add this line to your ~/.bashrc file for automatic sourcing on each terminal session:
source /opt/ros/noetic/setup.bashor for ROS 2:
source /opt/ros/humble/setup.bashAfter updating ~/.bashrc, reload it:
source ~/.bashrcLaunch RViz
Simply run RViz using the terminal command:
rvizHow to launch RViz in ROS2:
rviz2Verify Installation
If RViz launches successfully, you should see the RViz interface. You can start adding different displays and interact with the visualization tools.
This installation guide assumes you are using a compatible version of Ubuntu with ROS. If you’re using a different operating system or ROS version, you may need to adjust the instructions accordingly.
Final Thoughts
In summary, RViz is an invaluable tool for anyone diving into robotics. It transforms complex data into clear visuals, helping you understand your robot’s environment. Remember, every expert was once a beginner. Embrace the learning curve, experiment with RViz, and don’t hesitate to seek help when needed.


